Re: Group Assignment: Post # 2 (Answer)
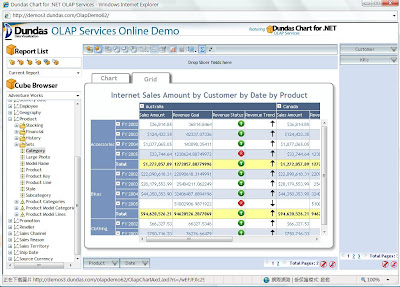
1st report: Internet Sales Amount by Geography by Date by Product
It is shown the yearly sales amount, revenue goal, trend, and status by each category in different countries.
Based on this report, the company can be well known her sales trend of each category by different countries and she can decide to put how much effort on each category. Also, according to the report, the company will base on the good performance figures to have a further development on the specific category in the specific country and try to achieve the maximization of sales amount.
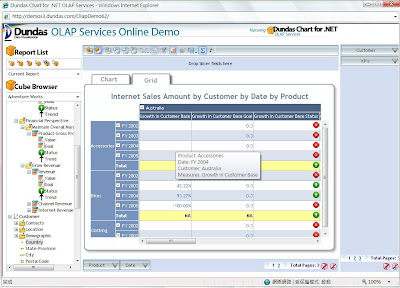
2nd report: Internet Sales Amount by Customer by Date by Product
It is shown the growth of customer base (yearly) by each category by different countries.
Based on this report, the company can understand the growth of her customer base by each category by different countries and decide to plan the new/strong promotion for attracting as well increasing the new customers in the poor performance category in specific country.
Besides, the company can study the figures of the good performance and do the good offers for the customers to maintain these customer base.
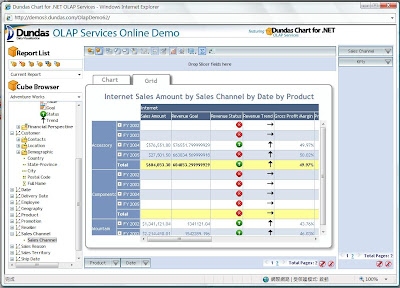
3rd report: Internet Sales Amount by Sales Channel by Date by Product
It is shown the sales amount and gross margin by category by the sales channels.
Based on this report, the company can understand the profitability of each category by sales channels and try to make the maximization of profit on each category by each channel. Also, company can be according to the best sales amount of the category to negotiate with suppliers/producers to get the best offer in order to increasing the gross margin value. Moreover, company can decide to take off the category of lowest gross margin for minimizing the company cost.
The benefits of allowing users to query a data warehouse in the form of an OLAP cube through their Web browser are as follows:
1st report: Internet Sales Amount by Geography by Date by Product
It is shown the yearly sales amount, revenue goal, trend, and status by each category in different countries.
Based on this report, the company can be well known her sales trend of each category by different countries and she can decide to put how much effort on each category. Also, according to the report, the company will base on the good performance figures to have a further development on the specific category in the specific country and try to achieve the maximization of sales amount.

2nd report: Internet Sales Amount by Customer by Date by Product
It is shown the growth of customer base (yearly) by each category by different countries.
Based on this report, the company can understand the growth of her customer base by each category by different countries and decide to plan the new/strong promotion for attracting as well increasing the new customers in the poor performance category in specific country.
Besides, the company can study the figures of the good performance and do the good offers for the customers to maintain these customer base.

3rd report: Internet Sales Amount by Sales Channel by Date by Product
It is shown the sales amount and gross margin by category by the sales channels.
Based on this report, the company can understand the profitability of each category by sales channels and try to make the maximization of profit on each category by each channel. Also, company can be according to the best sales amount of the category to negotiate with suppliers/producers to get the best offer in order to increasing the gross margin value. Moreover, company can decide to take off the category of lowest gross margin for minimizing the company cost.

The benefits of allowing users to query a data warehouse in the form of an OLAP cube through their Web browser are as follows:
- It is the good tools for consolidating, analyzing, and providing access to large amounts of data to improve decision making.
- It is easy and time-saving to view/run the data in different ways or from different dimensions.
- Users can change the demensions or data being viewed flexibly.
- Users can run and view the same data from the large databases to make the further decision for his company.
Re: Group Assignment: Post # 2 (Answer I)
Regarding Jenny's comment, we have modified the report and dragged the reseller name into it.
Report will be called Internet Sales Amount by Reseller by Date by Product.
The purpose is mentioned as the above on 3rd report.
The purpose is mentioned as the above on 3rd report.

Good answers ! You've demonstrated a solid grasp of OLAP analysis and reporting.
回覆刪除Just one quick comment on Report No. 3. This compares gross profit margin for two sales channels - Internet and Reseller. You may want to change this so that you're comparing gross profit margin for different resellers (Reseller Name is also a possible dimension).
Thanks Jenny.
回覆刪除We have added the modified report into it.
Please take a look and comment it.